

The following simulations refer to the paper
F. Zanlungo, C. Feliciani, Z. Yücel, K. Nishinari and T. Kanda,
Macroscopic and microscopic
dynamics of a pedestrian cross-flow: Part II, modelling,
Safety Science, Vol 158, 105969 (2023)
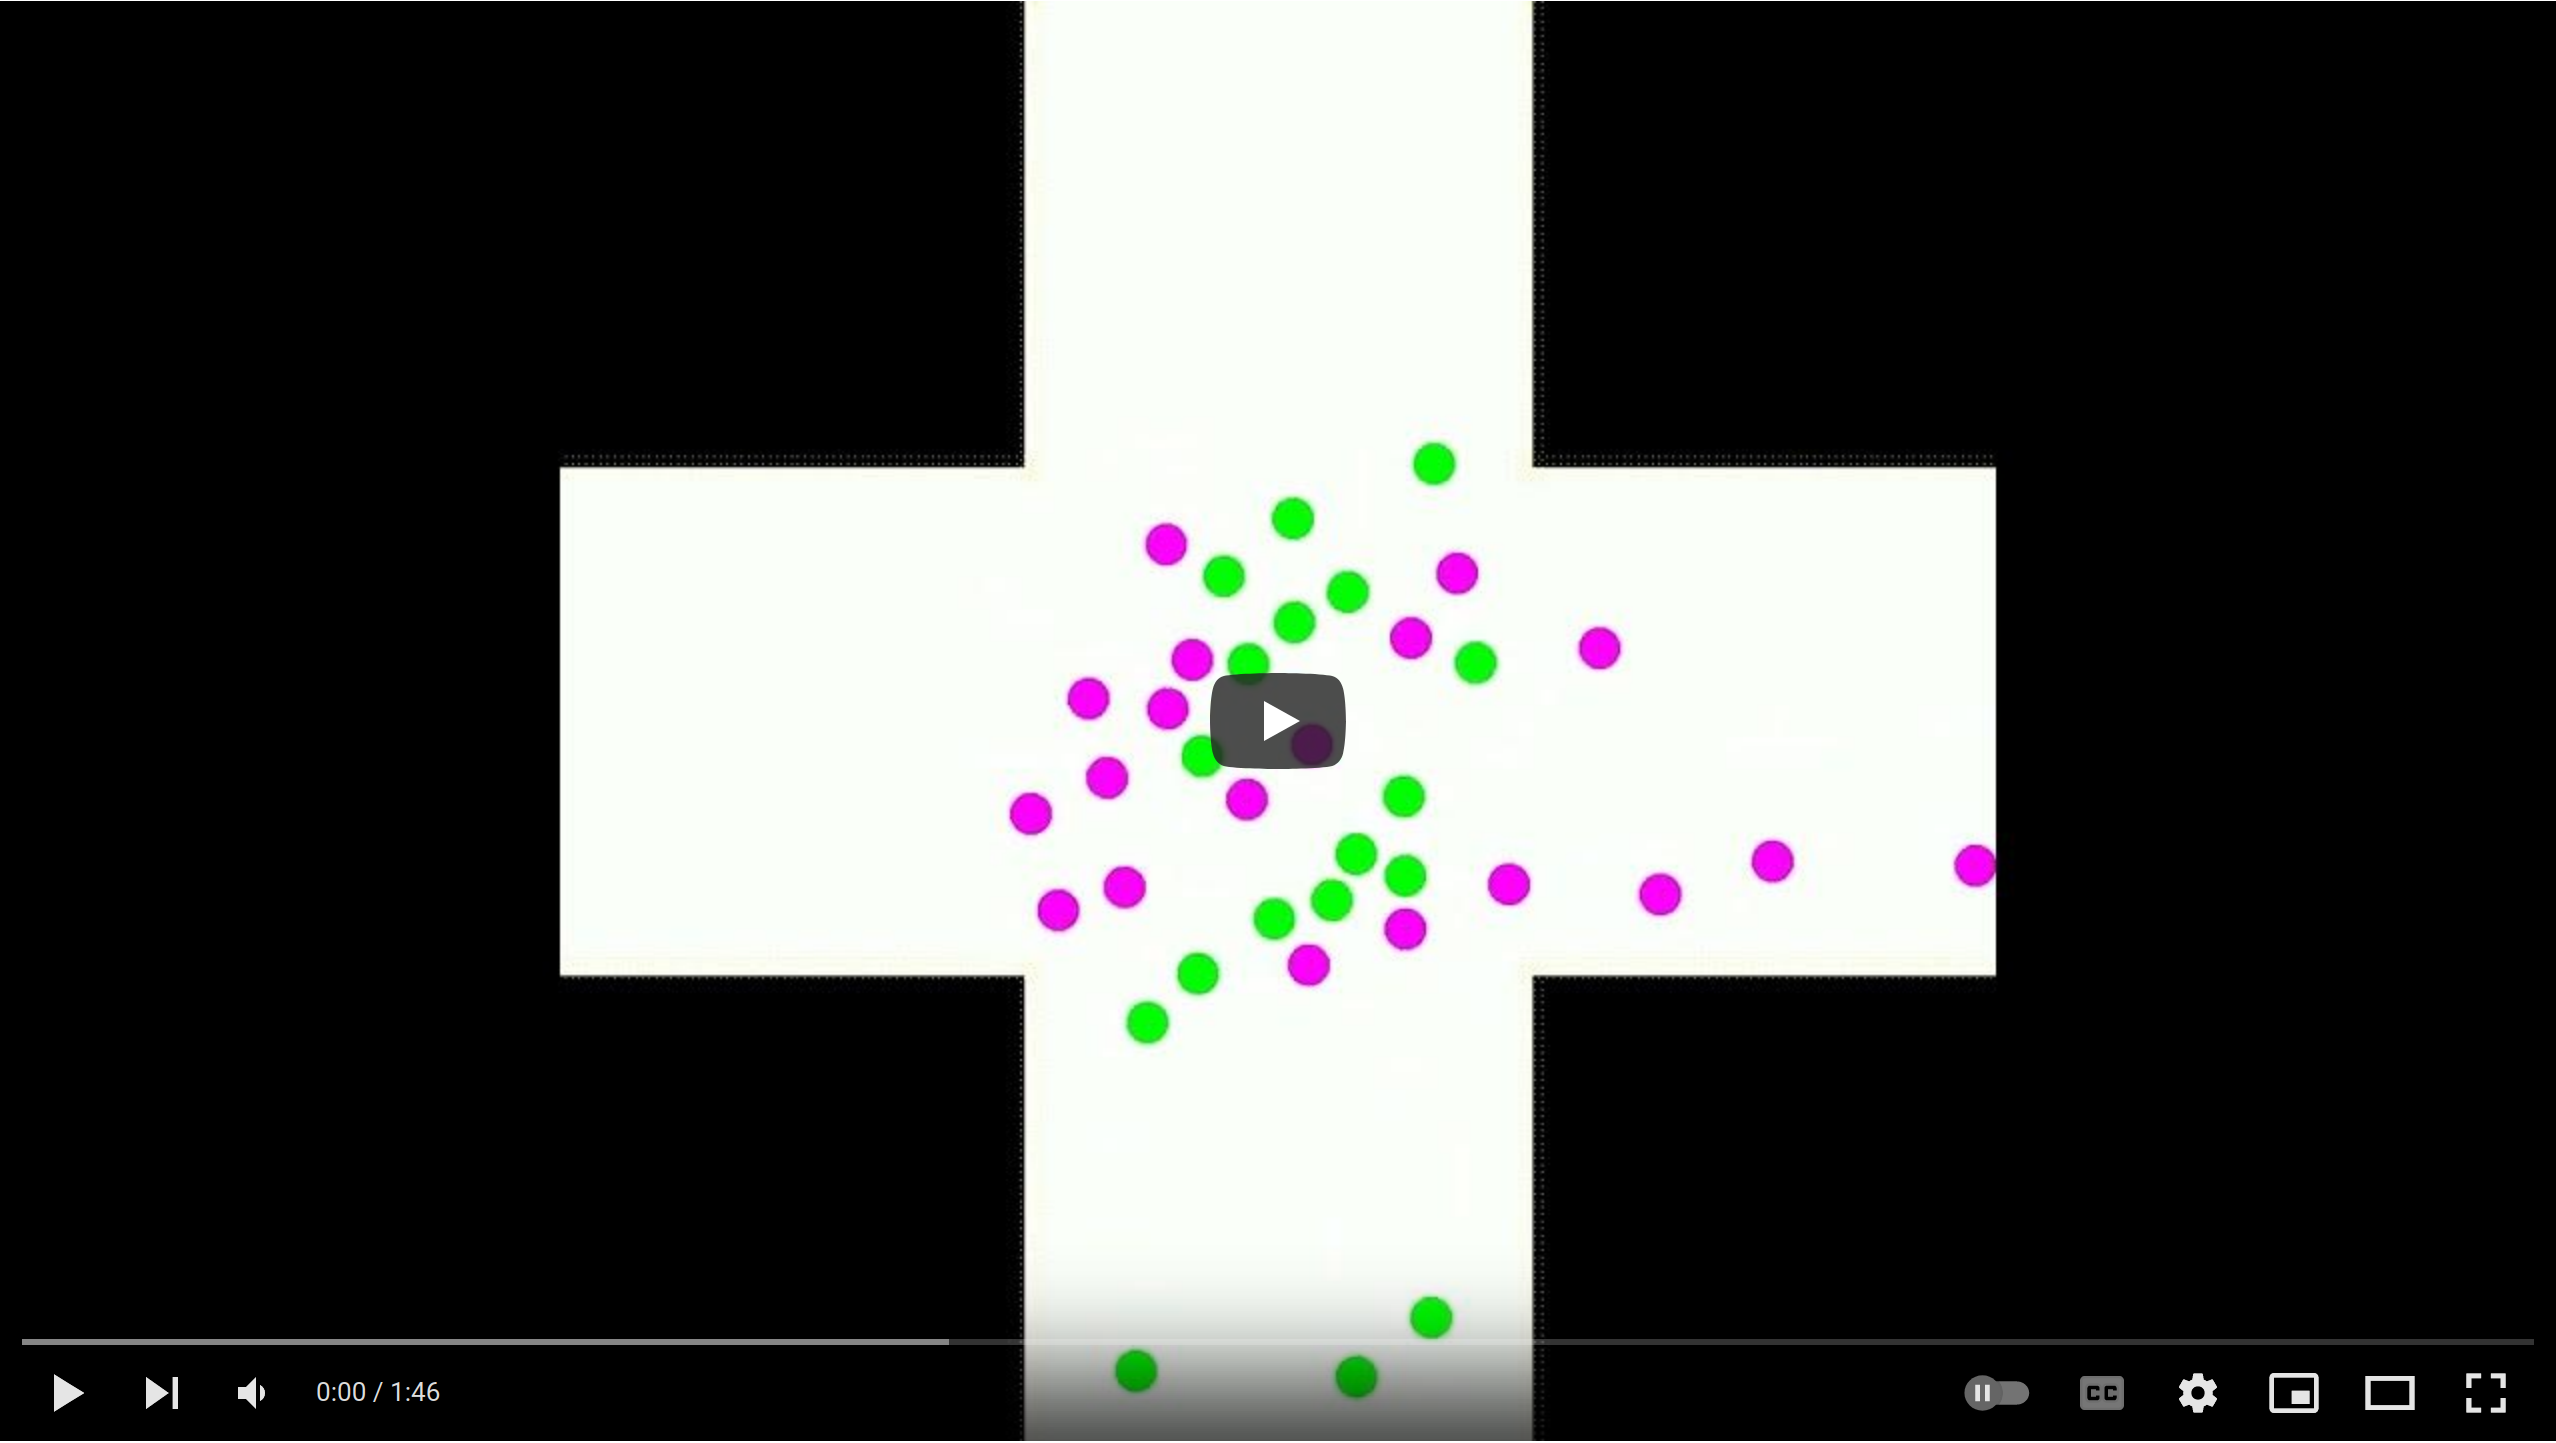
Detailed prediction of collisions taking in account body size
The original "collision prediction" model was actually taking in consideration (along with velocity-related information) only relative distances between body centres, but did not use explicit information concerning body size. Theoretical considerations suggest that taking in account relative distances between body centres provides the most natural way to reproduce collision avoidance in low to medium density settings, while taking in account body size is important in high density settings. We developed a model that joins both approches, and calibrated (and evaluated) it on the experimental behaviour of human subjects in a controlled cross-flow setting experiment.
Click on the thumbnail to watch.
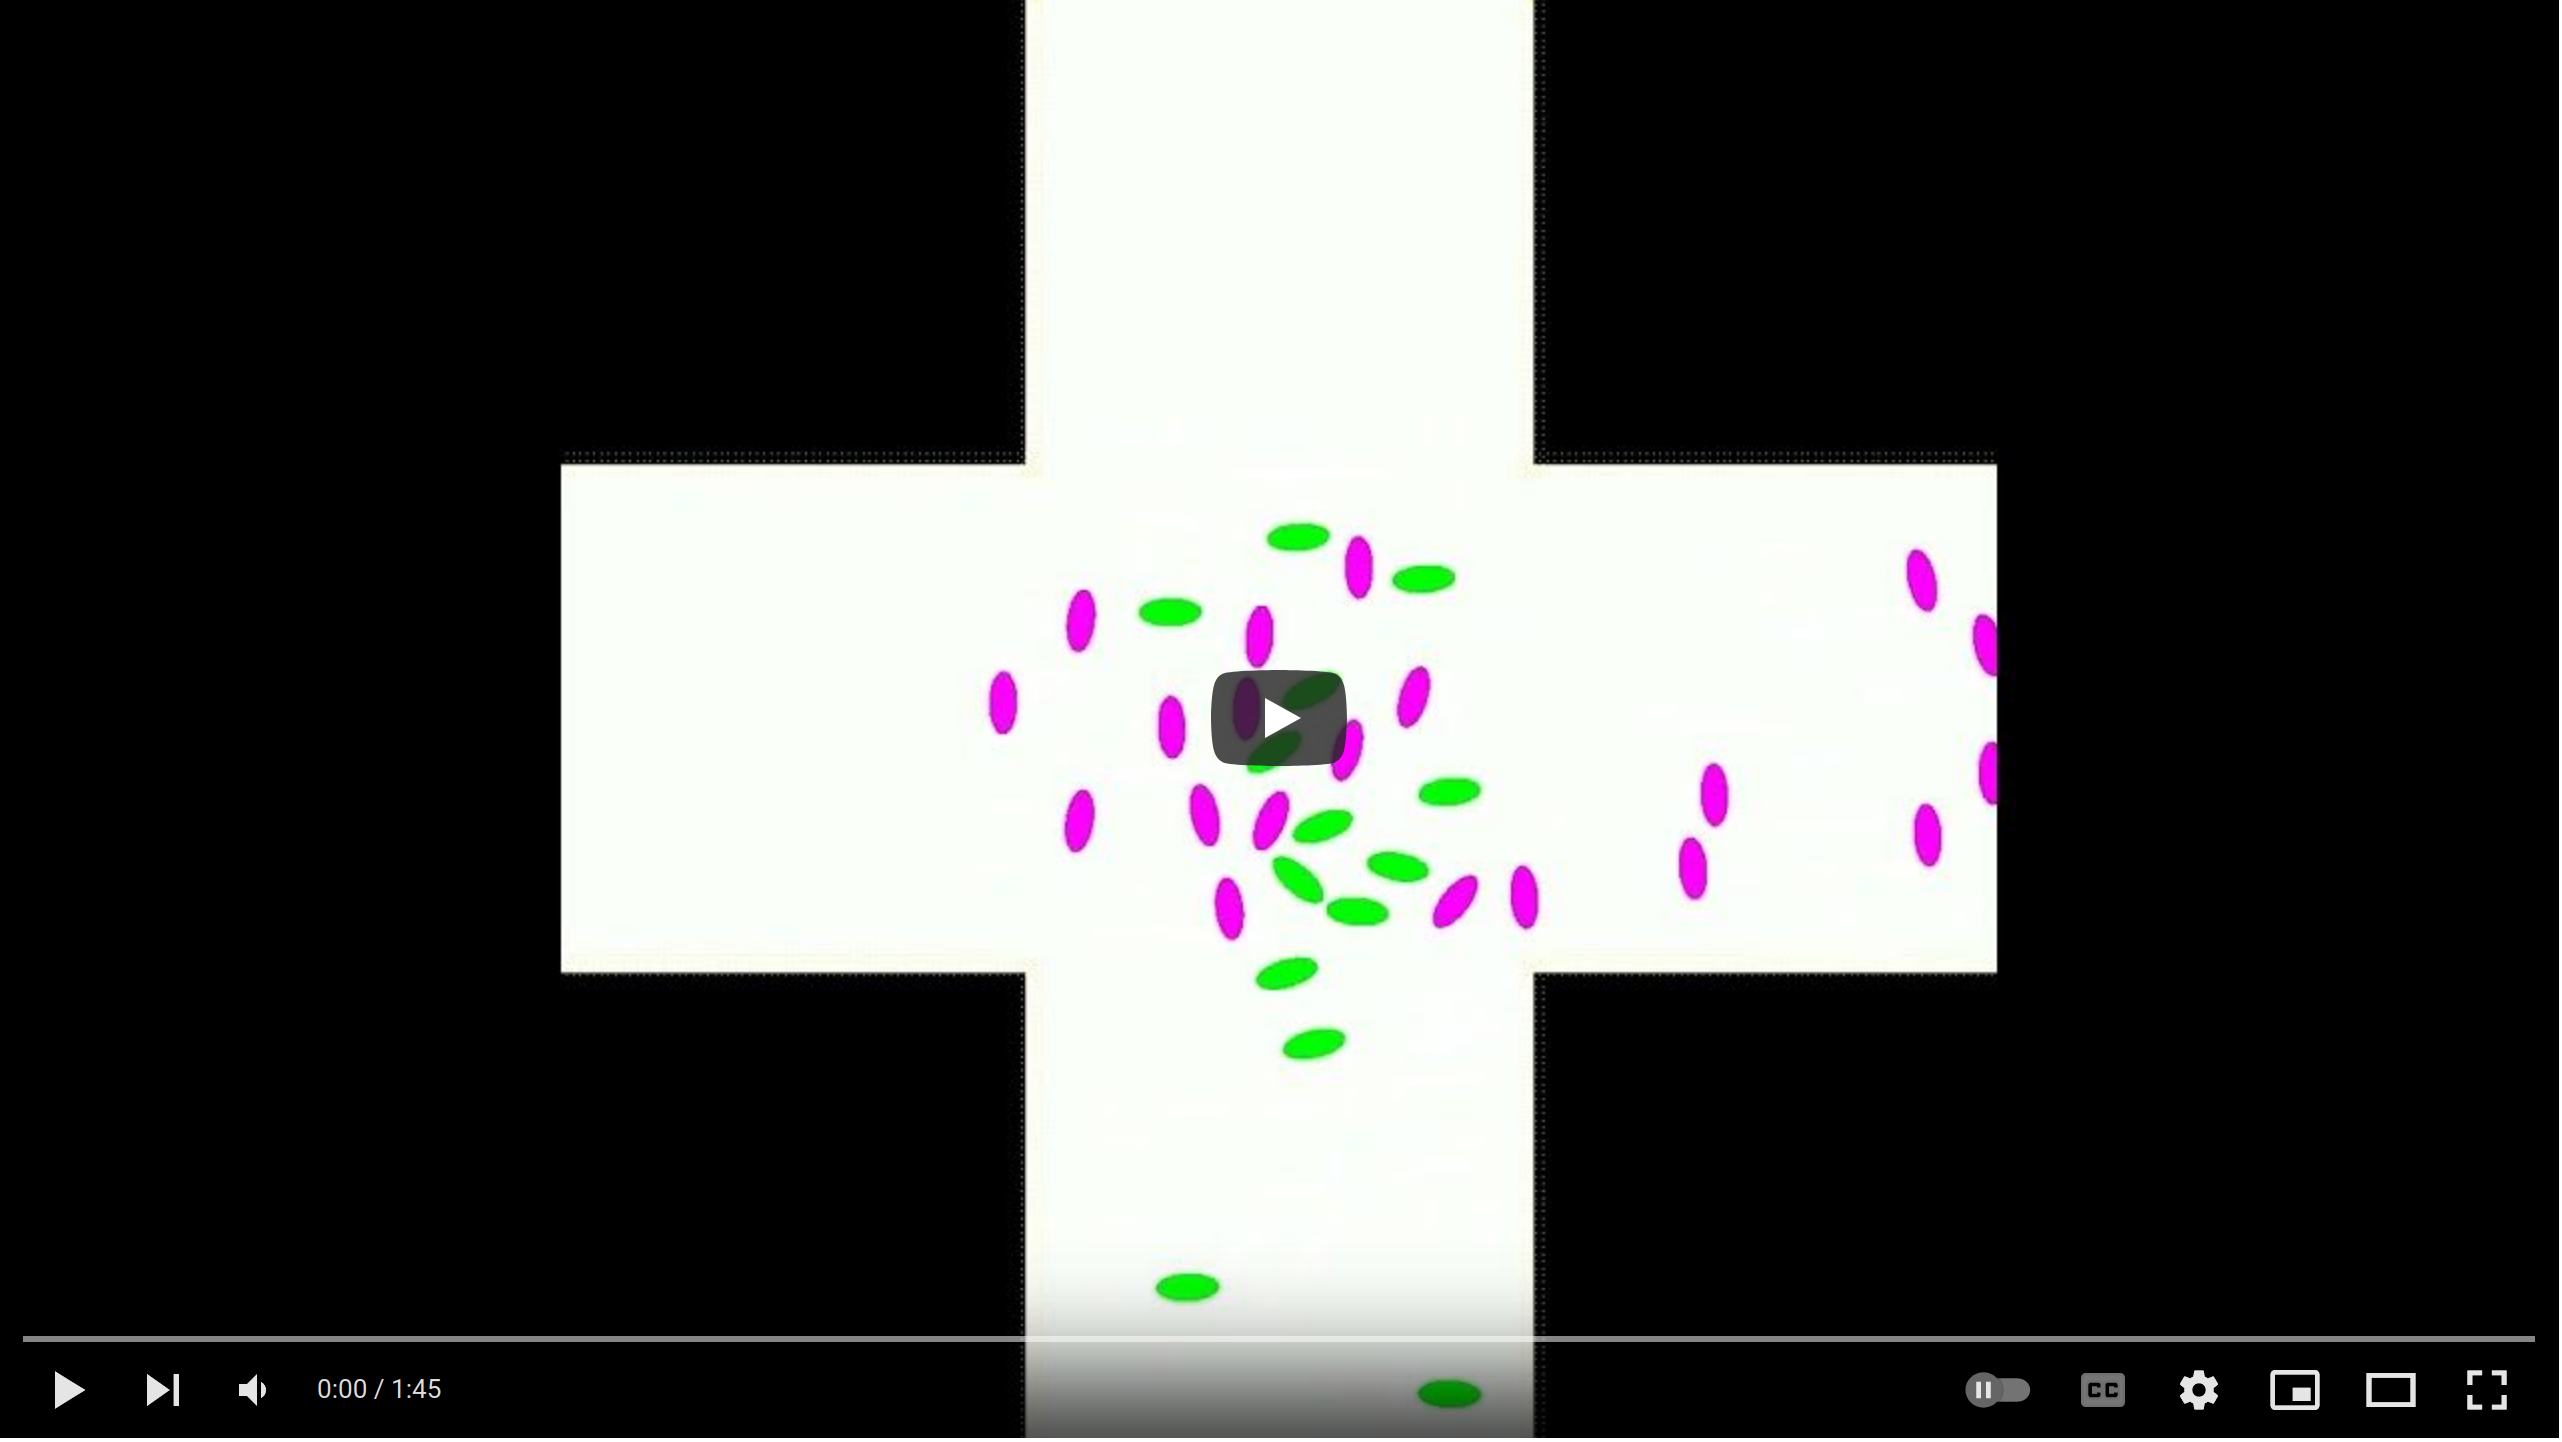
Detailed prediction of collisions taking in account body size and orientation
In the simulation above, although we took in consideration body size, we used a "circular body" (disk), and thus we could not take in consideration body orientation. As our experimental data included also such information, we proposed and calibrated also an "elliptical model".
Click on the thumbnail to watch.
The following simulations refer to the paper
F. Zanlungo, T. Ikeda and T. Kanda,
Social force model with explicit collision
prediction,
Europhysics Letters, Volume 93, 68005
Model calibration and validation
We calibrated our pedestrian model on controlled experiments with 4 or 8 subjects, of which we tracked the motion. To each subject a start and arrival point was provided in such a way to have a complex many-pedestrian collision avoiding behaviour in the centre of the experiment room. the first video below shows the reproduction of the experiments through the model, i.e. the behaviour of the model after calibration. Simulated pedestrians disappear at the time in which the corresponding real pedestrian (subject) exited the tracking area.
For validation, after calibrating on the experiments with 4 subjects, and we reproduced the 8 subjects experiments giving the same starting and goal points of the real pedestrians to the virtual ones. The second video below shows the behaviour of virtual pedestrians (hollow) compared to real ones (solid circles).
Click on the thumbnails to watch.


Lane formation
The second video below demonstartes the lane formation at high density in our pedestrian model. At this densities, the model shows its limits (in particular in the transition to equilibrium).
Click on the thumbnails to watch.
Test in a complex environment
The following video pressents the test of our pedestrian model in a complex environment with 12 main routes.
Click on the thumbnail to watch.

The following simulations refer to the paper
F. Zanlungo, T. Ikeda and T. Kanda,
A microscopic social norm model to obtain
realistic macroscopic velocity and density pedestrian distribution,
PLoS ONE(2012): e50720
Tilt in position and velocity
The first simulation shows the behaviour of our "Collision Prediction" pedestrian model when coupled with a "tilt in position" to obtain the left handed lane organisation of Japanese pedestrians. As a result, the faster pedestrians (bright colours) overtake on the left and walk close to the walls. The parameters of the model were calibrated on real world pedestrian behaviour, as described in the paper, but for these simulations we used higher density and a wider velocity distribution to highlight the effect. 100 pedestrians (50 for each direction) are located in a 100X8 metres corridor with boundary conditions, with random initial conditions (only a 40 meters portion of the corridor is shown). The initial 150 seconds and the "equilibrium configuration" (after half an hour) are shown (not in real time).
The second simulation shows the behaviour of our "Collision Prediction" pedestrian model when coupled with a "tilt in velocity" (social norm) to obtain the left handed lane organisation of Japanese pedestrians. As a result, the faster pedestrians (bright colours) overtake on the right and walk close to the centre. The parameters of the model were calibrated on real world pedestrian behaviour, as described in the paper, but for these simulations we used higher density and a wider velocity distribution to highlight the effect. 100 pedestrians (50 for each direction) are located in a 100X8 metres corridor with boundary conditions, with random initial conditions (only a 40 meters portion of the corridor is shown). The initial 150 seconds and the "equilibrium configuration" (after half an hour) are shown (not in real time).
Click on the thumbnails to watch.